10 Jul What’s the cost per lot across SEQ Growth Corridors
By Troy Schultz
Thanks to our friends at Peak Urban who are our guest bloggers this week. This article is so helpful for anyone developing in South East Queensland, we really appreciate Peak Urban sharing this information with our clients.
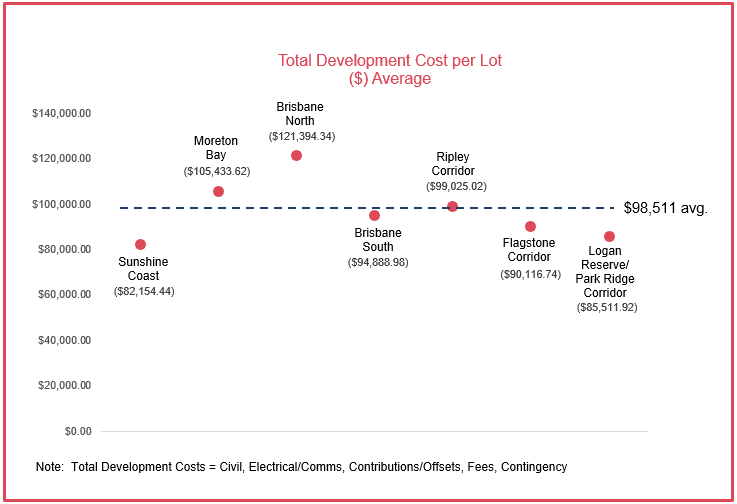
We know that developers need to act quickly to secure development sites. Quite often a quick, informed assessment of a site using typical revenue and cost data is sufficient to enable a site value to be ascertained and a high level offer put in front of the vendor. To assist our clients, we have collated and analysed data to calculate the average cost per lot cost for greenfield development across the various SEQ growth corridors. This data is based on 104 projects across 23,000 residential allotments (78 projects in feasibility stage and 26 projects in delivery). Project size ranges from 20 to 2,000 lots.
The following summary shows the average per lot costs as well as a high/low range observed across projects in each region. As the data shows, costs can vary significantly from project to project, largely driven by the uniqueness of each site, specific infrastructure servicing and the local market dynamics such as material supply rates and lot sizes. Whilst we acknowledge nothing beats a comprehensive due diligence, the average figures presented below can act as a good rule of thumb for an initial higher order assessment (with DD to follow on).
Table 1: Average Internal, External and Total Developments Costs
| Internal Civil 1 | External/Major Civil 2 | Total Development Costs 3 | |
| Region/Area | Average per Lot | ||
| Sunshine Coast | $40,299 | $15,688 | $82,154 |
| Moreton Bay | $42,968 | $16,966 | $105,434 |
| Brisbane North | $51,780 | $30,027 | $121,394 |
| Brisbane South | $38,961 | $10,312 | $94,889 |
| Ripley Corridor | $43,630 | $11,315 | $99,025 |
| Flagstone Corridor | $36,535 | $8,429 | $90,117 |
| Logan Reserve/Park Ridge Corridor | $37,397 | $10,721 | $85,512 |
1. Civil costs to service allotments.
2. Civil costs not directly associated with servicing allotments.
3. Includes civil, electrical/comms, Authority fees, contributions and offsets, professional fees and 10% contingency.
Table 2: Average Development Costs with High/Low Range
| Internal Civil | External/Major Civil | Total Development Costs | |||||||
| Region/Area | Average | Low | High | Average | Low | High | Average | Low | High |
| Sunshine Coast | $40,299 | $33,930 | $72,881 | $15,688 | $ – | $19,688 | $82,154 | $74,397 | $127,600 |
| Moreton Bay | $42,968 | $27,985 | $50,277 | $16,966 | $ – | $35,878 | $105,434 | $72,372 | $129,756 |
| Brisbane North | $51,780 | $34,153 | $65,873 | $30,027 | $ – | $80,015 | $121,394 | $79,315 | $172,754 |
| Brisbane South | $38,961 | $27,695 | $58,472 | $10,312 | $ – | $28,675 | $94,889 | $69,388 | $128,072 |
| Ripley Corridor | $43,630 | $32,070 | $68,469 | $11,315 | $2,928 | $40,377 | $99,025 | $79,496 | $126,350 |
| Flagstone Corridor | $36,535 | $34,362 | $38,241 | $8,429 | $ – | $93,491 | $90,117 | $84,510 | $93,491 |
| Logan Reserve/Park Ridge Corridor | $37,397 | $31,800 | $55,135 | $10,721 | $556 | $17,093 | $85,512 | $75,242 | $107,752 |
As stated, nothing beats a good comprehensive DD, however the data presented here should be useful for high level assessments and benchmarking purposes. We would be happy to discuss any of the data and assist in developing more detailed cost estimates to assist with your next project.
The original article can be found here. With many thanks to Peak Urban.

